By Stormly Team in Knowledge
Last Edited: Apr 2, 2026 Published: Jul 18, 2022
Benefits of Dashboards for Product Analytics Teams (With Examples)
A product analytics dashboard takes the behavioral data your store or product generates (purchase funnels, cart abandonment rates, repeat buyer cohorts, revenue per customer) and surfaces it in one place, updated automatically. Instead of running queries or building one-off reports every time someone asks “how are customers doing?”, the answer is already there.
This article covers the practical benefits of dashboards for e-commerce and product analytics teams, what to track, and how to make sure your dashboards actually drive decisions rather than just look good in reviews.
What Is a Product Analytics Dashboard?
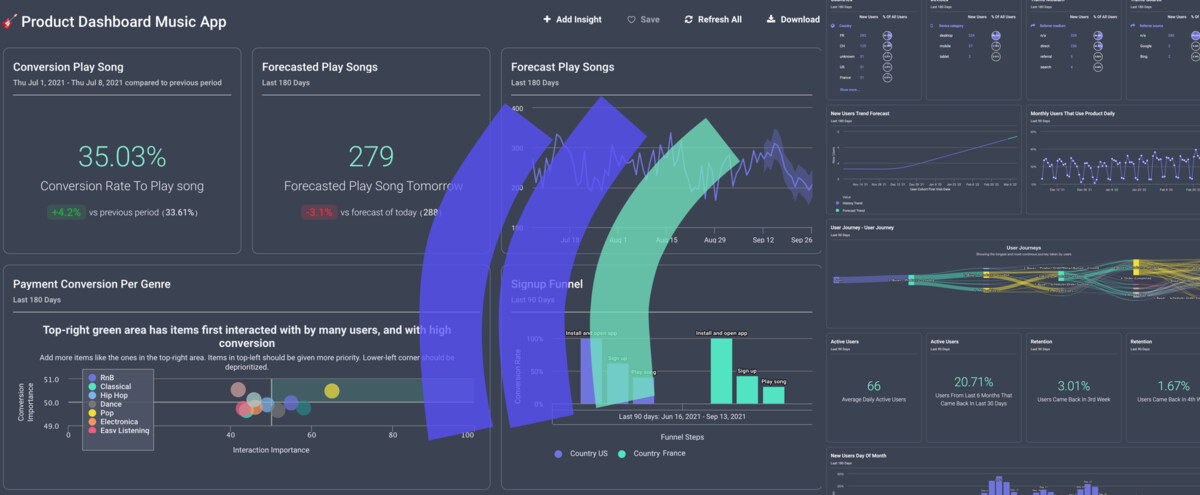
A product analytics dashboard is a live view of the metrics that matter most to your e-commerce team, typically purchase funnel conversion, cart abandonment rate, repeat purchase rate, and revenue per customer. Unlike a static report, a dashboard updates automatically as new data comes in and can be shared with anyone on the team without a SQL query or a data request.
Most product analytics platforms let you build dashboards from existing analyses: add a funnel, a retention chart, and an active user graph to the same view, and you have a working dashboard in minutes.
Key Benefits of Dashboards for Analytics Teams
1. Everything in One Place
The most immediate benefit is consolidation. Instead of jumping between a funnel report, a retention analysis, and a revenue breakdown, a dashboard puts all of them on one screen. For a product manager who checks the same five metrics every morning, that’s meaningful saved time.
It also reduces the number of one-off data requests to analysts. When the answers are visible to anyone on the team, fewer people need to ask for them.
2. Spot Trends Before They Become Problems
Because dashboards update continuously, they let you see movement in your metrics as it happens, not at the end of the quarter. A cart abandonment spike that starts on Tuesday is far easier to investigate and fix when you catch it that week, not at the end of the quarter.
Automated anomaly detection takes this further: instead of manually scanning your dashboard for changes, the system flags when a metric moves outside its expected range and can alert you by email. This is particularly useful for teams that don’t have the bandwidth to review dashboards daily.
3. Share Insights Without Writing Reports
One of the most underrated dashboard benefits is communication. When findings are in a shared dashboard rather than a slide deck, stakeholders can access the data directly, ask their own follow-up questions, and check progress without waiting for a monthly report.
Scheduled email delivery strengthens this further: you can set a dashboard to send to your team or stakeholders automatically whenever new segments, anomalies, or predictions are found. The insight reaches the right people without anyone needing to remember to look.
4. Stay Aligned Across Teams
Product, marketing, engineering, and customer success teams often care about overlapping metrics but look at different slices. A shared dashboard with clear metric definitions reduces the friction of “which number is right?” conversations. When everyone is looking at the same source, alignment is easier.
5. Make Data-Driven Decisions Faster
A dashboard reduces the gap between a question (“are users who activated last month still active?”) and an answer. For product teams working in fast iteration cycles, that speed compounds: more decisions made with data, faster learning loops, better product outcomes over time.
What to Track on a Product Analytics Dashboard
The right metrics depend on your product stage and goals, but a core product analytics dashboard typically includes:
- Purchase funnel conversion: where shoppers drop off between product page view, add to cart, and completed order
- Cart abandonment rate: what percentage of shoppers add items but don’t complete checkout, and how that trends over time
- Repeat purchase rate: what percentage of customers buy again within 30, 60, or 90 days
- Revenue per customer: average order value and how it varies by acquisition channel or customer segment
- Customer retention by product/category: which products or behaviors drive customers to return
- Aha moment: the early behavior (e.g., first purchase category, time-to-first-order) that predicts long-term loyalty
For a deeper look at which metrics to prioritize, see Six Key Product Metrics Every Product Manager Should Track.
How to Make Your Dashboard Actionable
A dashboard that shows data is not the same as a dashboard that drives action. The difference is usually in how it’s designed.
A few principles that help:
- One question per dashboard. A dashboard trying to show everything shows nothing clearly. Build separate dashboards for cart performance, repeat purchase health, and product page conversion.
- Add context to the numbers. A retention rate of 35% means nothing without a target or a comparison to last month. Include period-over-period comparisons wherever possible.
- Include the “so what.” Where the dashboard allows, annotate key changes with what happened: a product launch, a campaign, a bug fix. Context makes trends interpretable.
For more on this, see How to Make Your Dashboards More Actionable.
Getting Started
If your team is currently answering product questions through one-off queries or manual reports, dashboards are the next step. Start with the three questions most e-commerce teams ask most often: cart abandonment, purchase funnel conversion, and repeat purchase rate. Most product analytics platforms, including Stormly, let you build and share dashboards without writing SQL.
Start a free trial to build your first product analytics dashboard.
Last updated: April 2026