By Aleks Sztemberg in Knowledge
Published: May 4, 2022
Why Power BI is not the best tool to improve your product
Most product managers would agree that Power BI is a great tool for reporting and data visualization. However, many find that it does not help improve their product. In this blog post, we will explore some of the reasons why Power BI might not be the best tool for product management and suggest the best alternative. Stay tuned!
While Power BI can be a very useful visualization tool, it is important to remember that it alone does not necessarily improve or even help your product. In fact, there is a risk that relying too heavily on this tool could end up doing more harm than good.
This is because Power BI may introduce unforeseen biases, and it may lead product teams to focus too much on making data look pretty rather than ensuring that their product actually provides value to customers.
Ultimately, product managers need to be mindful of the ways in which Power BI might skew their decision-making processes and strive to strike a balance between visual appeal and product effectiveness. Otherwise, they may find themselves chasing an illusory goal while missing out on the real opportunities for product improvement that lie hidden within their data.
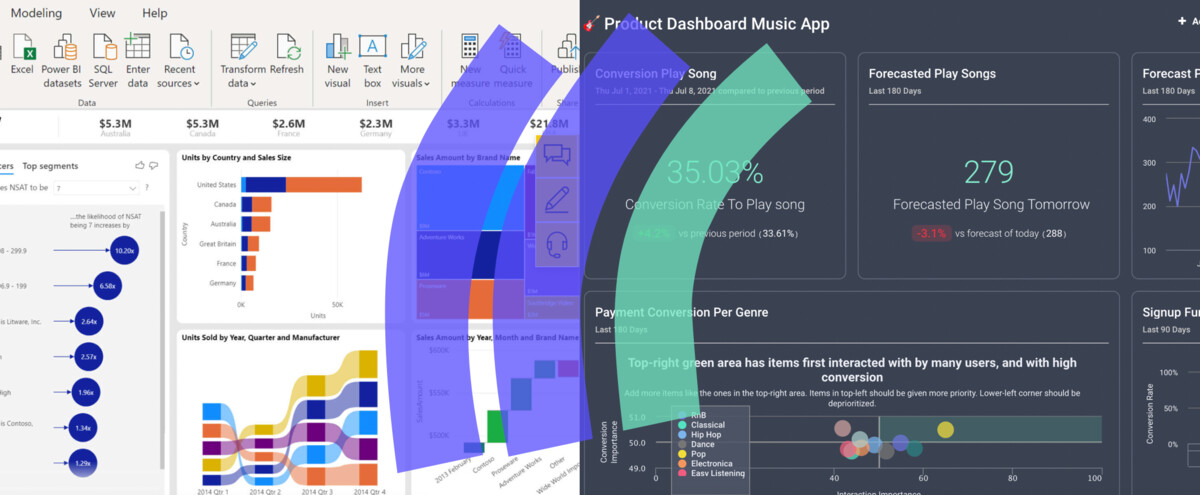
Although Power BI and other data visualization tools are not a relevant tool for Product Managers, they simplify the process of creating visual representations of large data sets for Designers. Read more about the best data visualization tools available today.
Whether we are talking about business analytics or data visualization tools, one of the most important aspects is the quality and accuracy of the data that you work with. While Power BI may be a popular choice among users, it is limited in that it only works with data that is already collected. For alerting on changes instead of reacting late, see how to implement anomaly detection.
Thus, if your data sets are incomplete or incorrect, Power BI will not be able to help you make sense of them. In contrast, Stormly takes a more proactive approach by automating the collection of necessary data so that you always have access to accurate and complete information.
With this added layer of oversight and control, Stormly can help ensure that you have all the information you need to make well-informed decisions. So if accuracy and quality are your top priorities when it comes to working with data, then Stormly is definitely worth a closer look.
The process of working with Power Bi can be a daunting one, as there are many factors to consider when trying to extract meaningful data and build effective visualizations. One of the biggest hurdles that users face is translating their data into queries and visualizations.
In order to do so effectively, they need advanced knowledge of how to build queries and create visualizations and must be able to think critically about which metrics they should be looking at and how best to present those metrics.
Additionally, working with Power Bi often involves a lot of trial and error, as users are forced to experiment in order to find the best ways to work with their data.
While Power BI is often touted as the premier data analysis and visualization tool, it is not without its limitations. In particular, unlike other tools like Stormly, Power BI does not offer the ability to re-use user segments or apply user filters in every single insight. The planning side of this is covered in how to do forecasting the right way.
This means that product analytics in Power BI can be a bit clunky and time-consuming, as users must create the same segment or filter over and over again for different insights.
By contrast, Stormly allows you to define user segments once and then reuse them again and again with a simple click of a button, giving you much more flexibility and control over your product analytics.
So if you want a tool that lets you truly zoom in on specific user behavior in order to improve your product, then Stormly is the clear choice. After all, when it comes to product analytics, there’s no substitute for being able to do things with ease and precision.
As anyone who has ever dealt with data knows, it can be a challenge to keep track of everything. Stormly takes care of that for you by hosting your data in the cloud.
Not only does it have ready insights that are easy to understand and use, but also applies machine learning models to deliver actionable insights automatically. The active users insight, for example, lets you define what behavior makes a user active with just a few clicks.
Whether you’re dealing with a product launch or trying to track customer behavior, Stormly is the tool you need to make sure your data is always accessible and easy to understand.
Though Power BI is a powerful tool for analyzing and visualizing data, it does have some downsides. For one, it can be quite expensive, with each data license costing significant amounts of money. If you are watching live product health, read forecasting and detecting anomalies in active users.
Additionally, the total cost of using Power BI can quickly add up if you are not careful. It is therefore important to carefully consider what you really need from the platform and whether investing in it will help you to improve your product or deliver better returns for your company. On top of that, cleaning and ingesting data can be a time-consuming and resource-intensive process, especially when using BI products such as Power BI.
Not only does it require specialized skills and technical know-how, but a large amount of time, manpower, and financial resources are also typically required to complete this task successfully.
Furthermore, even if you were to outsource the data preparation process to a third party, this would likely incur additional costs that are above and beyond the standard license fees for Power BI.
Given these challenges and complexities, it is therefore no surprise that many organizations opt to shy away from using data visualization software like Power BI.
At first glance, Stormly and other product tracking tools may seem quite similar. After all, both rely on user data to provide insights into product performance and usage. However, unlike other tools on the market, Stormly takes a unique approach to product tracking.
Rather than requiring you to manually collect and organize product usage data, Stormly automatically collects this data in real-time and makes it easily accessible through an intuitive interface. In addition, this data is fully analyzed and visualized, giving you instant insights into product trends and improvements that can be made. For revenue-specific modeling, how to forecast Stripe sales is the closest companion.
By freeing you from the burden of product tracking and analysis, Stormly allows you to focus your time and energy on building great products for your users.
Power BI is a powerful data visualization tool that can be used to create beautiful, interactive visualizations of your product data. However, in order to use Power BI effectively, you need to have a clear understanding of your product and what you want to achieve with your data. Power BI can’t tell you what to do with your data, but it can be a valuable tool for helping you to understand your product and make decisions about how to improve it. If you don’t have a clear understanding of your product or what you want to achieve with your data, Power BI may not be the right tool for you.
So if you’re looking for comprehensive product analytics or need help optimizing specific features of your product, Stormly has got you covered!
We believe that product teams are the key to building a better product. With our easy-to-use interface and powerful features, you can quickly gain insights into how your users are engaging with your product, and make the necessary changes to improve all of your product’s key metrics.
Therefore, if you’re ready to take your product to the next level, sign up and give us a try today! We’re confident that Stormly can help you achieve all of your product goals.