
By Stormly Team in Knowledge
Published: Jan 29, 2023
More Accurate Product Usage Metrics With Relative Event Filtering
Product managers - how would you like a tool to help you leverage greater accuracy in your product usage metrics?
With more accurate product usage metrics, it’s possible to gain unprecedented insight into user behavior and keep track of performance trends.
Wouldn’t it be great if there was an easier way to make sure that the insights gleaned from these metrics were valid and could lead to effective decision making processes?
Well now there is - with relative event filtering at Stormly, getting pinpoint accuracy in product usage stats just got a lot simpler. Read on as we explore this exciting development and what it might mean for you!
Relative event filtering allows us to take a deeper look into the different actions and behaviors of our users. By exploring the relationship between one event based on another, we can uncover insights that lead us to powerful opportunities.
We can ask questions such as:
-
How many songs are played on average per user, after a user signs up, but only up to a maximum of 7 days after signup?
-
How many songs in total are played within 3 days of a user’s first time they shared a song?
-
For a funnel of installing the app, playing a song and finally completing payment, only count playing a song if it is the 3rd time a song is played.
-
How many songs are played on average in the third session of a user? Here a session can be customized with choosing a specific timeout in minutes, and the actions that have to be performed to count as a session.
-
How many songs are played on average per user before they upgraded, for users that eventually upgraded to premium versus those who didn’t?
In this article we’re going to answer the last question. For all others, see our Relative Event Filtering section in the Stormly Starter Tutorial.
When you first think about comparing the average number of songs played for users that paid for a premium account versus those that didn’t, you may think that a simple comparison that averages the songs played for users that paid versus those that didn’t is enough.
But we must remember that paid customers are more likely to use their subscription extensively. So in order to form a fair and accurate analysis, we should look at the data with a different lens. For alerting on changes instead of reacting late, see how to implement anomaly detection.
To make a more correct analysis, to see if the number of songs played has some kind of relation to upgrading to the paid plan, we need a different way to measure things.
We want to know if a user’s pattern of song plays had something to do with upgrading. Therefore, it is essential that we measure the average number of songs played before moving up to the paid plan. By understanding this relationship between usage and plan selection, we can better understand our consumers and make sure their needs are met.
With Stormly’s relative event filtering, we can do exactly that.
Click the top menu item called Reports. Then find the User Calculations report and open it.
Click Add item and select Event count, then the Play song event from the Screens menu.
From the dropdown on the left called Total select the Average per user option instead.
Our report setup should look now like this:

Now click on the gear icon behind the event name. From the dialog that follows click the input that says Click to define event criteria +.
Then select Is before or after another event, and select Payment completed from the Screens menu. From the dropdown options that follow, select is before.
We now have a filter for all play song events that happened before a payment event.

Click Apply to close the dialog and use the filter.
Because we want to compare users that upgraded versus those that didn’t, we need to use the of all users filter to compare those two groups. The planning side of this is covered in how to do forecasting the right way.
Click of all users and in the dialog that follows, Click to define filter + and select the Event count menu, and then Play song from the Screens category.
From the dropdown options select is greater than and enter 0. This means we’ll filter for all users that upgraded to the premium plan.

Click Apply to use the filter.
Finally, we want to add another item counting the average songs played, but for users that didn’t upgrade to premium.
Again, click Add item and select Event count, then the Play song event from the Screens menu.
From the dropdown on the left called Total select the Average per user option again.
Click of all users and in the dialog that follows, Click to define filter + and select the Event count menu, and then Play song from the Screens category.
From the dropdown options select is and enter 0. This means we’ll filter for all users that didn’t upgrade to the premium plan.
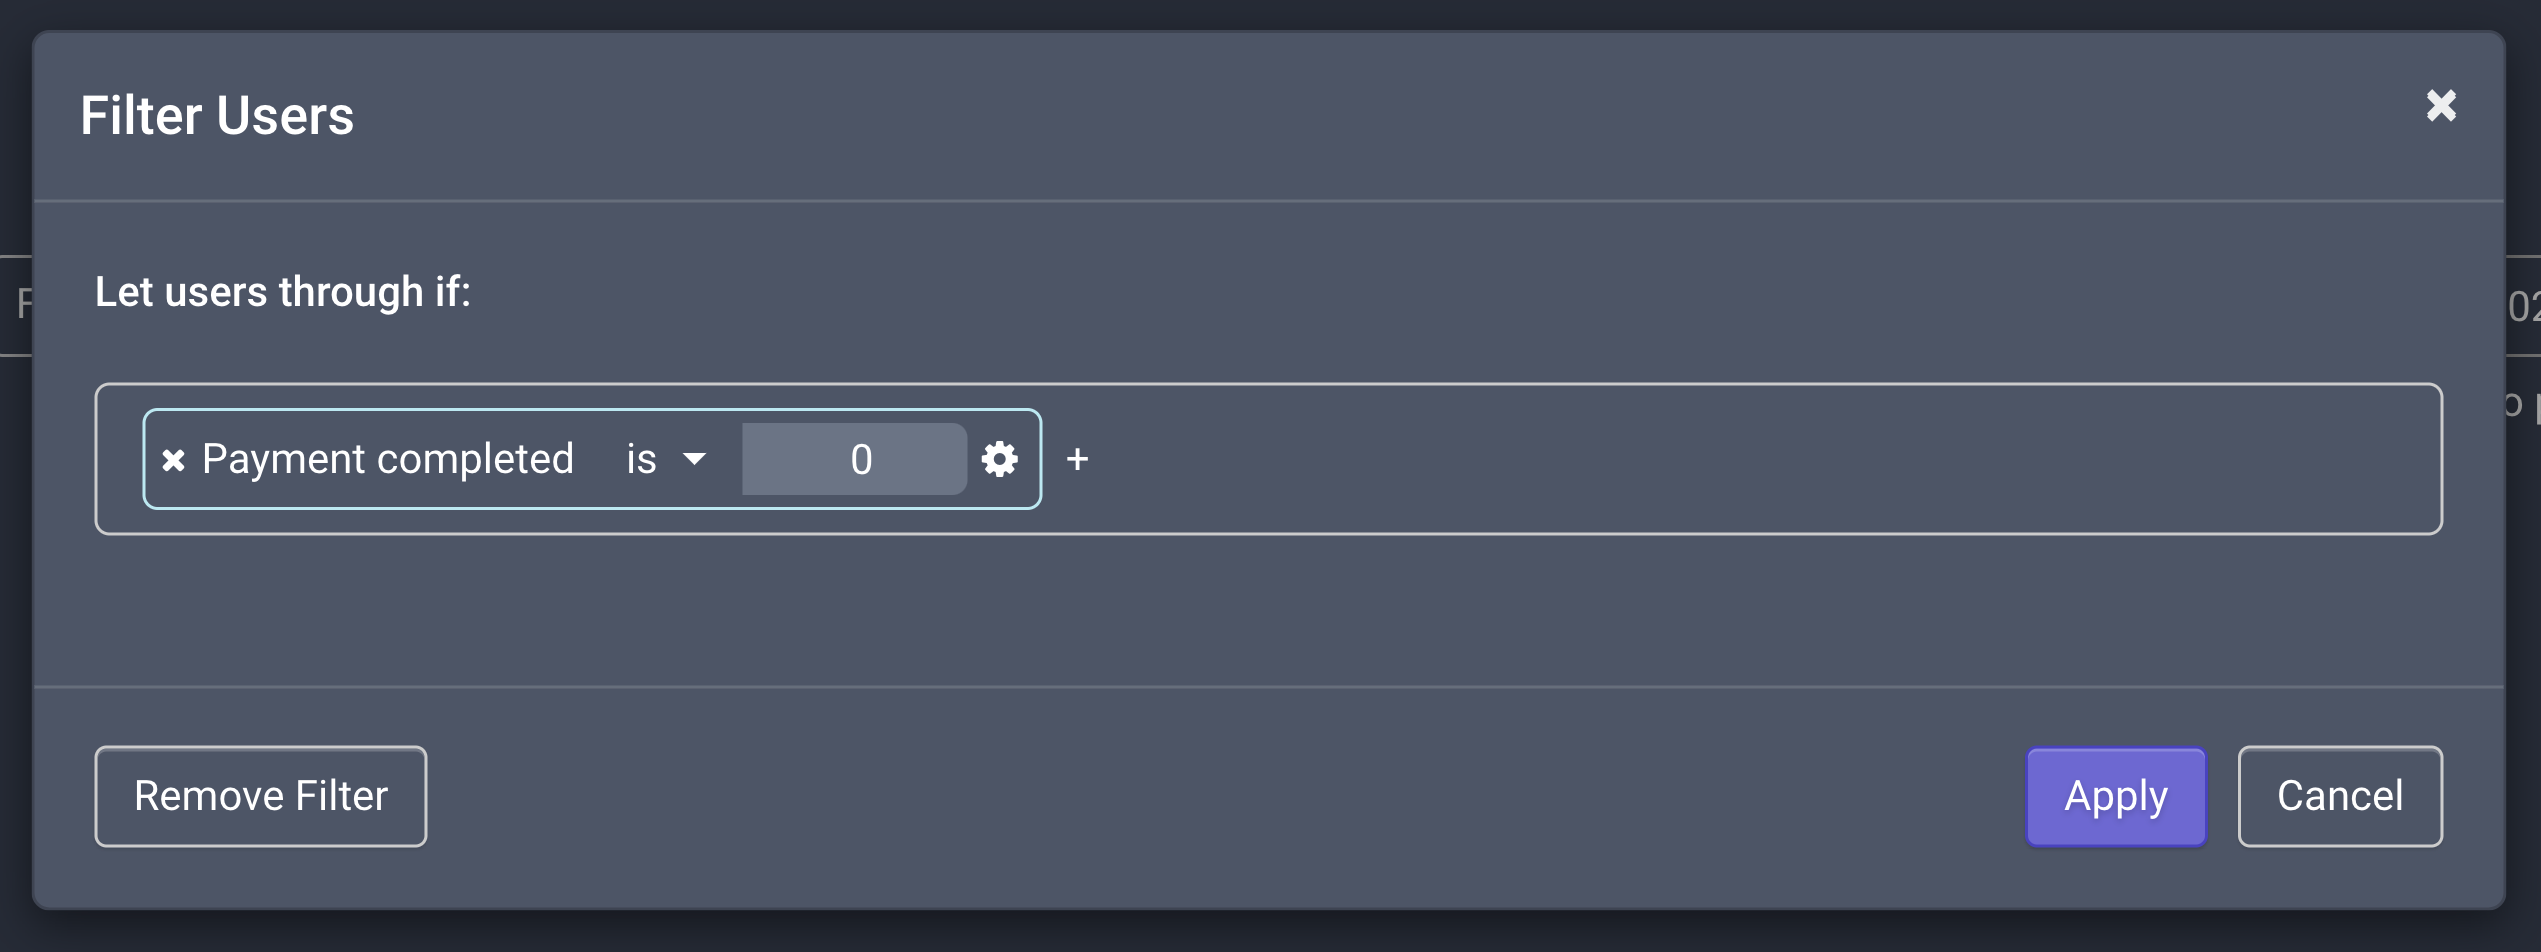
Click Apply to use the filter.
To make it easier to distinguish between the two metrics, let’s give them a descriptive name. Click on the pencil left of the first calculate item, and name it Avg. songs played - Did Upgrade. If you are watching live product health, read forecasting and detecting anomalies in active users.
Do the same for the second calculate item, and name it Avg. songs played - Didn’t Upgrade.
The final report setup should look like this:

Click Run now to get the results.
As we can see, those users that paid eventually played more songs on average, before they upgraded.

The User Calculations report is incredibly versatile, allowing you to get the exact metrics you are after. However, this often requires a lot of manual filter setup - something not everyone has the skillset or time for. As such, Stormly provides plenty of pre-made reports to save you hassle and time.
To get the same results as we did in this report in a simpler fashion, simply use the Converted VS Non-Converted Actions report. There you’ll find you only need to choose your conversion event and events you want to get averages from - simple!
So if flexibility is important but time is tight, make sure to give Stormly’s automated reporting features a try!
For more details you can read our section on relative event filtering in the Stormly starter tutorial.
We hope this article has given you a better understanding of relative event filtering and how it can be used to get pinpoint accuracy in product usage stats. This is just one of the many exciting developments that we’re working on at Stormly, so stay tuned for more! In the meantime, why not sign up to Stormly and give it a try? You’ll be amazed with what our platform can do.