
Stormly Features for Ecommerce Analytics
All your ecommerce metrics in one place, powered by an AI agent that explains what changed and what to do next. Built for teams on Shopify, Adobe Commerce / Magento, or Google Tag Manager.
Product analytics built for Ecommerce
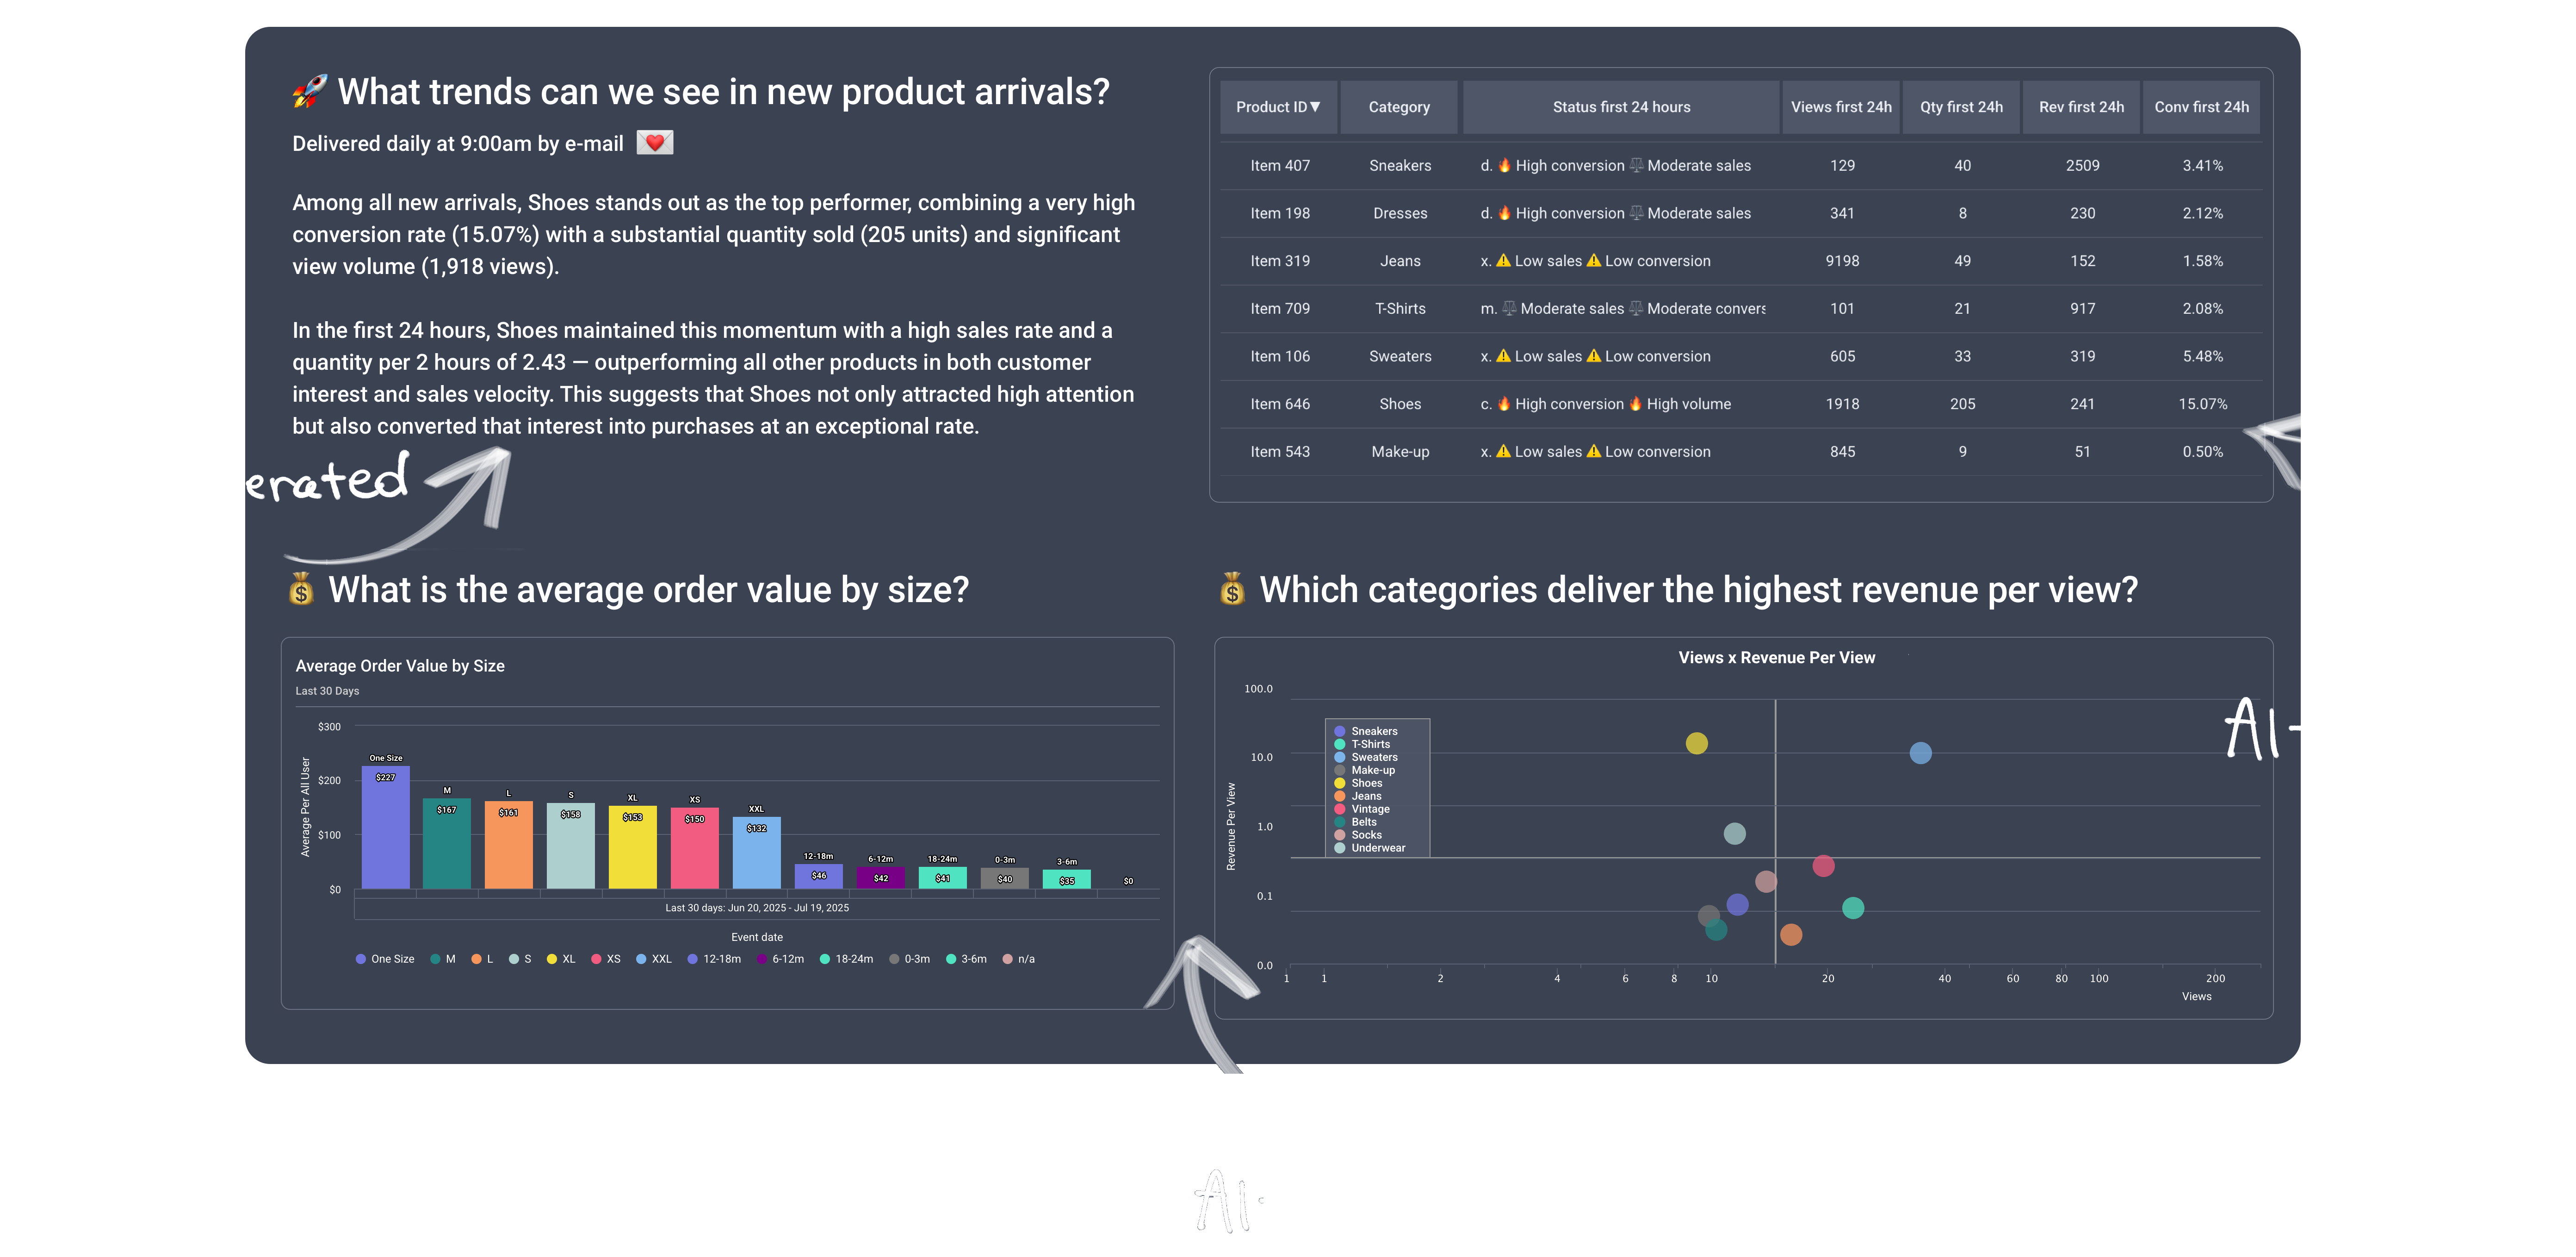
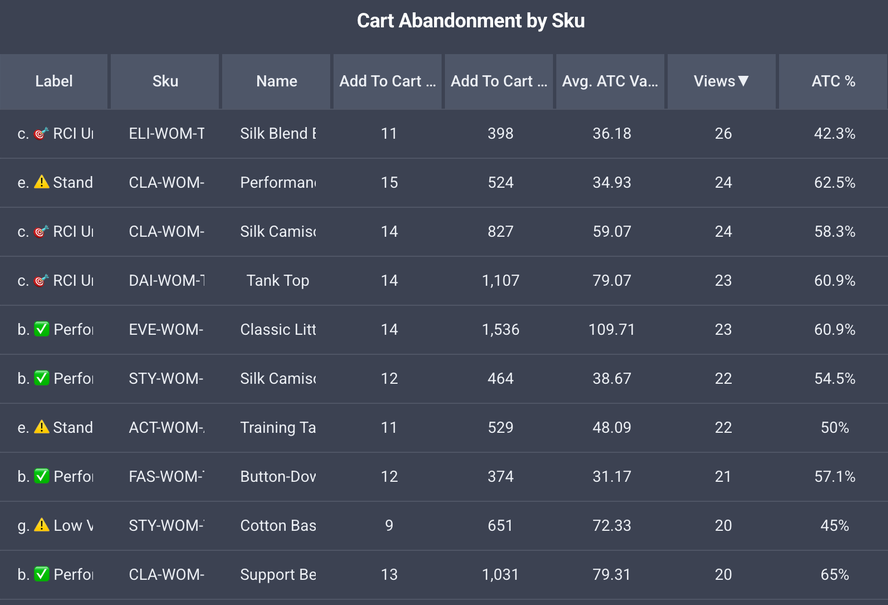
Build the view you need with ecommerce tailored reports, then pin them to a dashboard and layer on AI generated answers to your questions. Start with SKU, brand, and category reports like Cart Abandonment or New Arrivals, add filters for period over period comparison, and save the layout for your team.
Get plain language explanations with practical next steps. Keep the dashboard as your daily hub while the AI turns data into clear guidance you can act on.
AI Agent for ecommerce
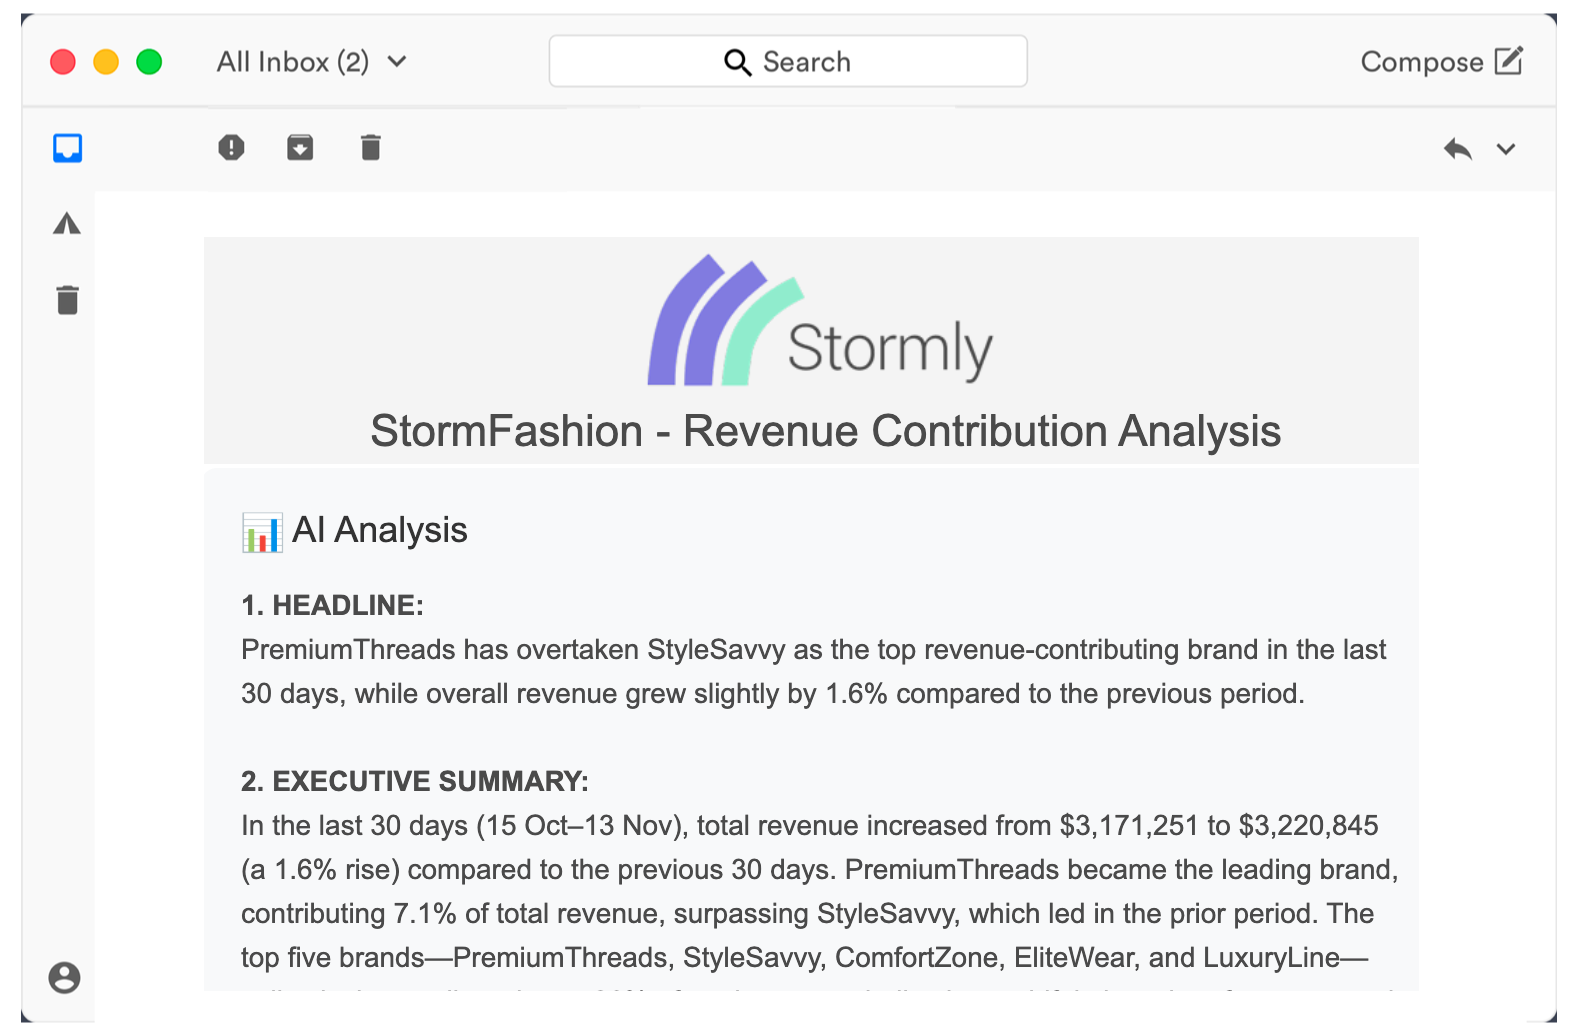
Ask our AI agent anything about any report to cut through the noise and get straight to the "so what." It will read the charts for you, explain the conclusions in plain language, and suggest next steps you can act on right away. You can also schedule brief summaries to land in your inbox every day or every week, so you stay on top of changes without opening a dashboard.
Collaborative dashboards for your team
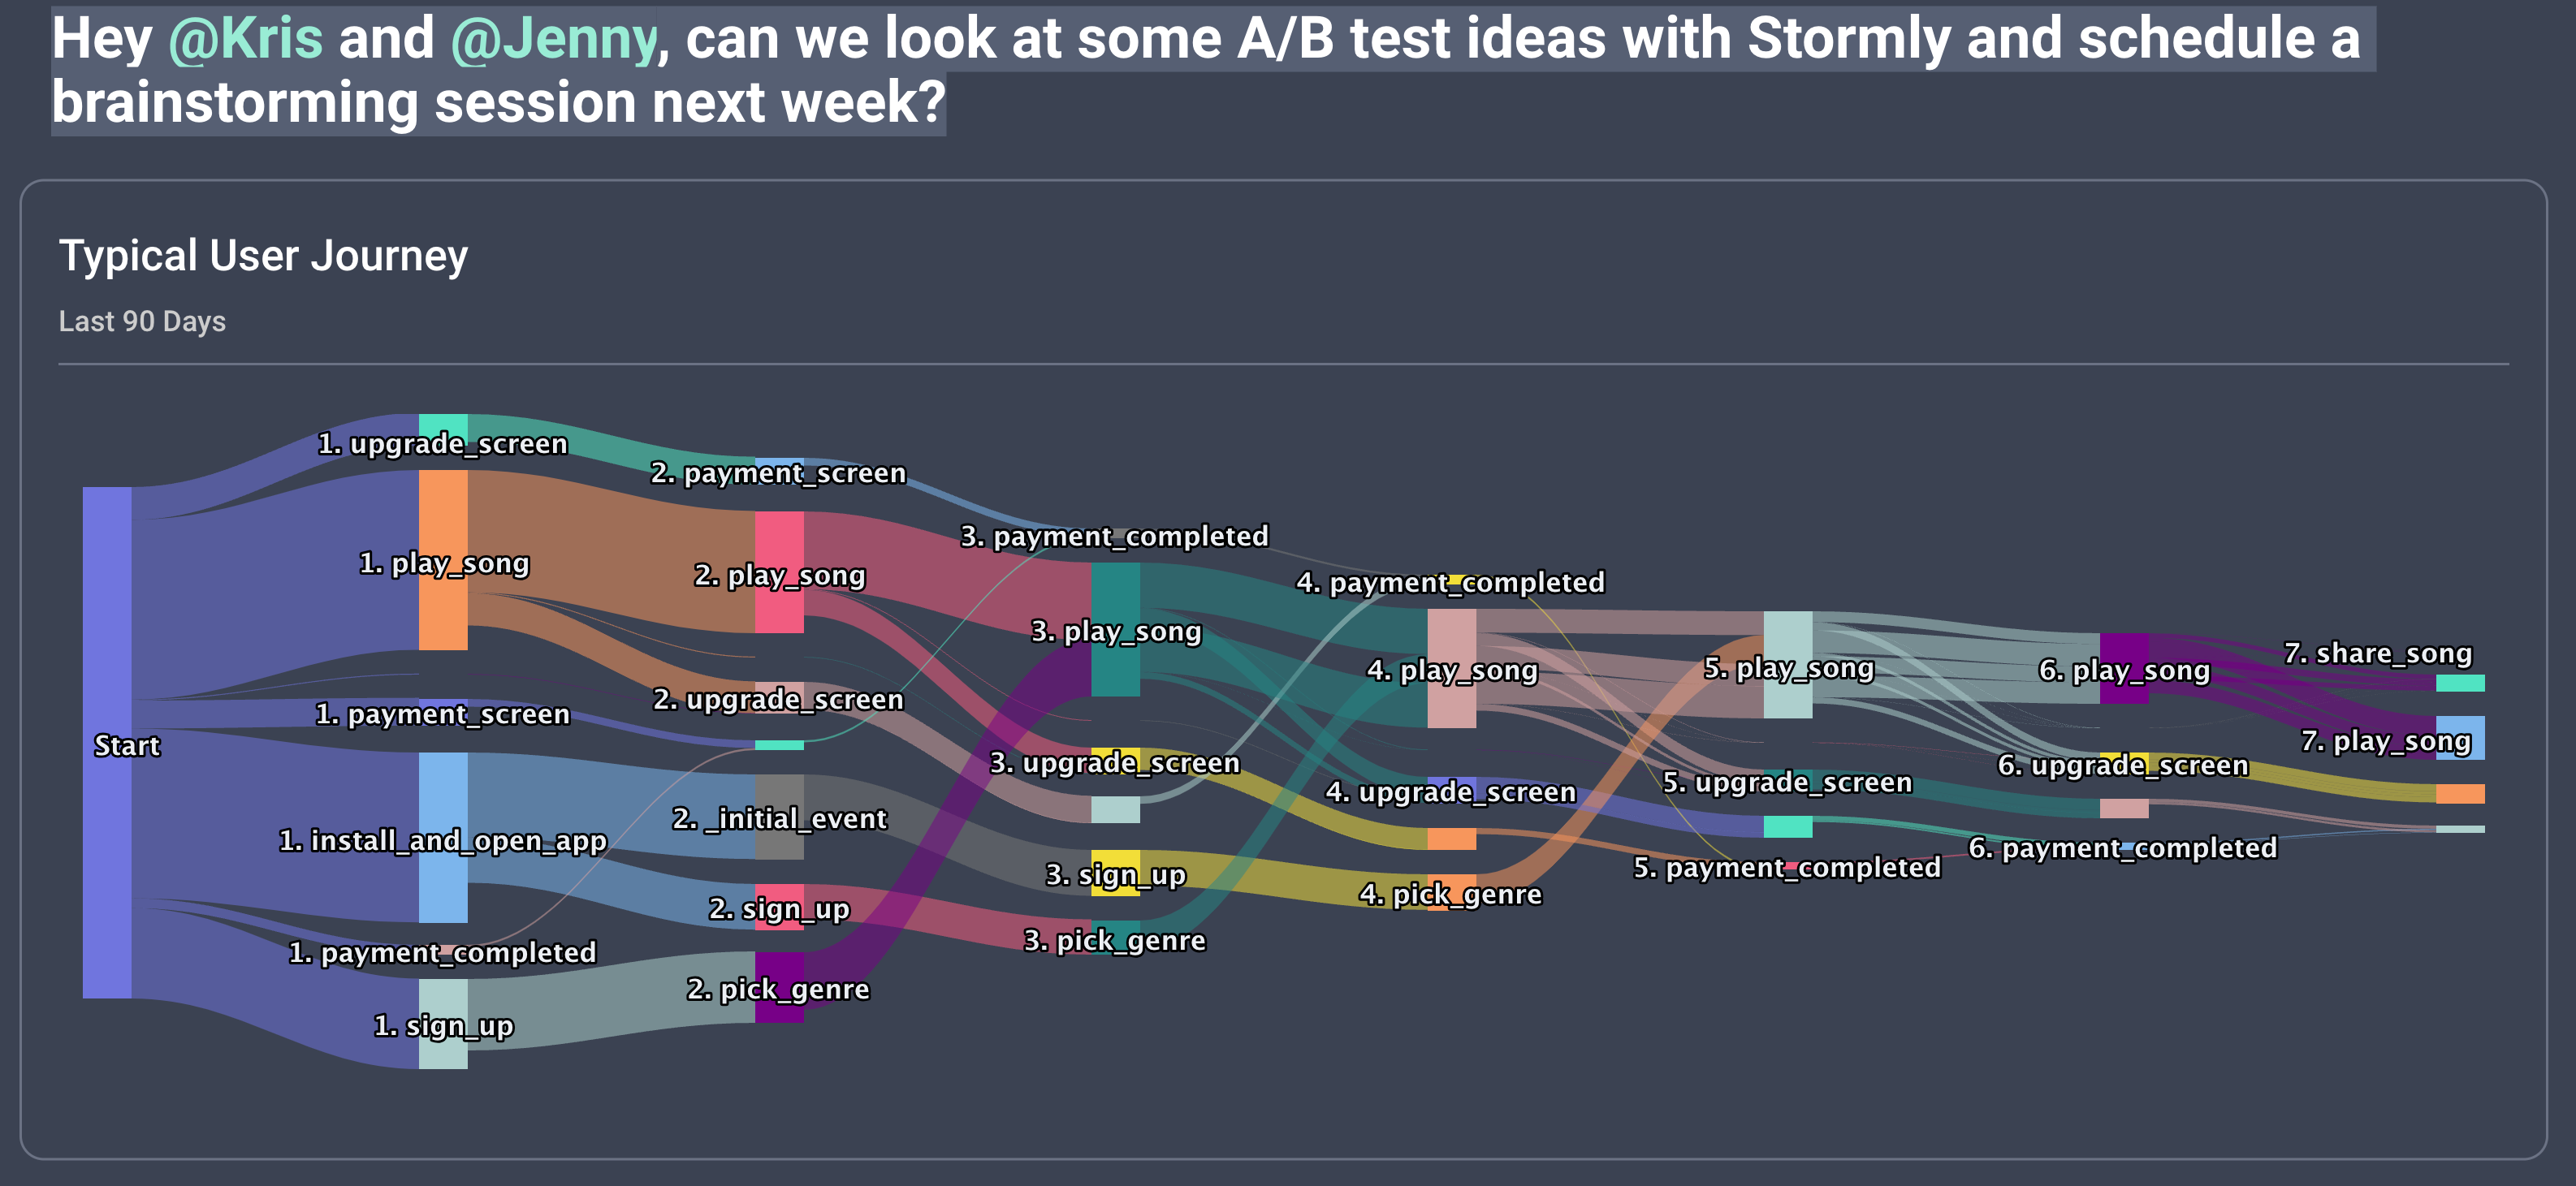
Create team dashboards that bring all ecommerce insights together in one place. Pair your dashboard with automatically generated Insights to track revenue, conversion, and product performance at a glance. Add notes, tag teammates, and align merchandising, growth, and operations on the next actions that move the numbers.
Sophisticated behavioral filters
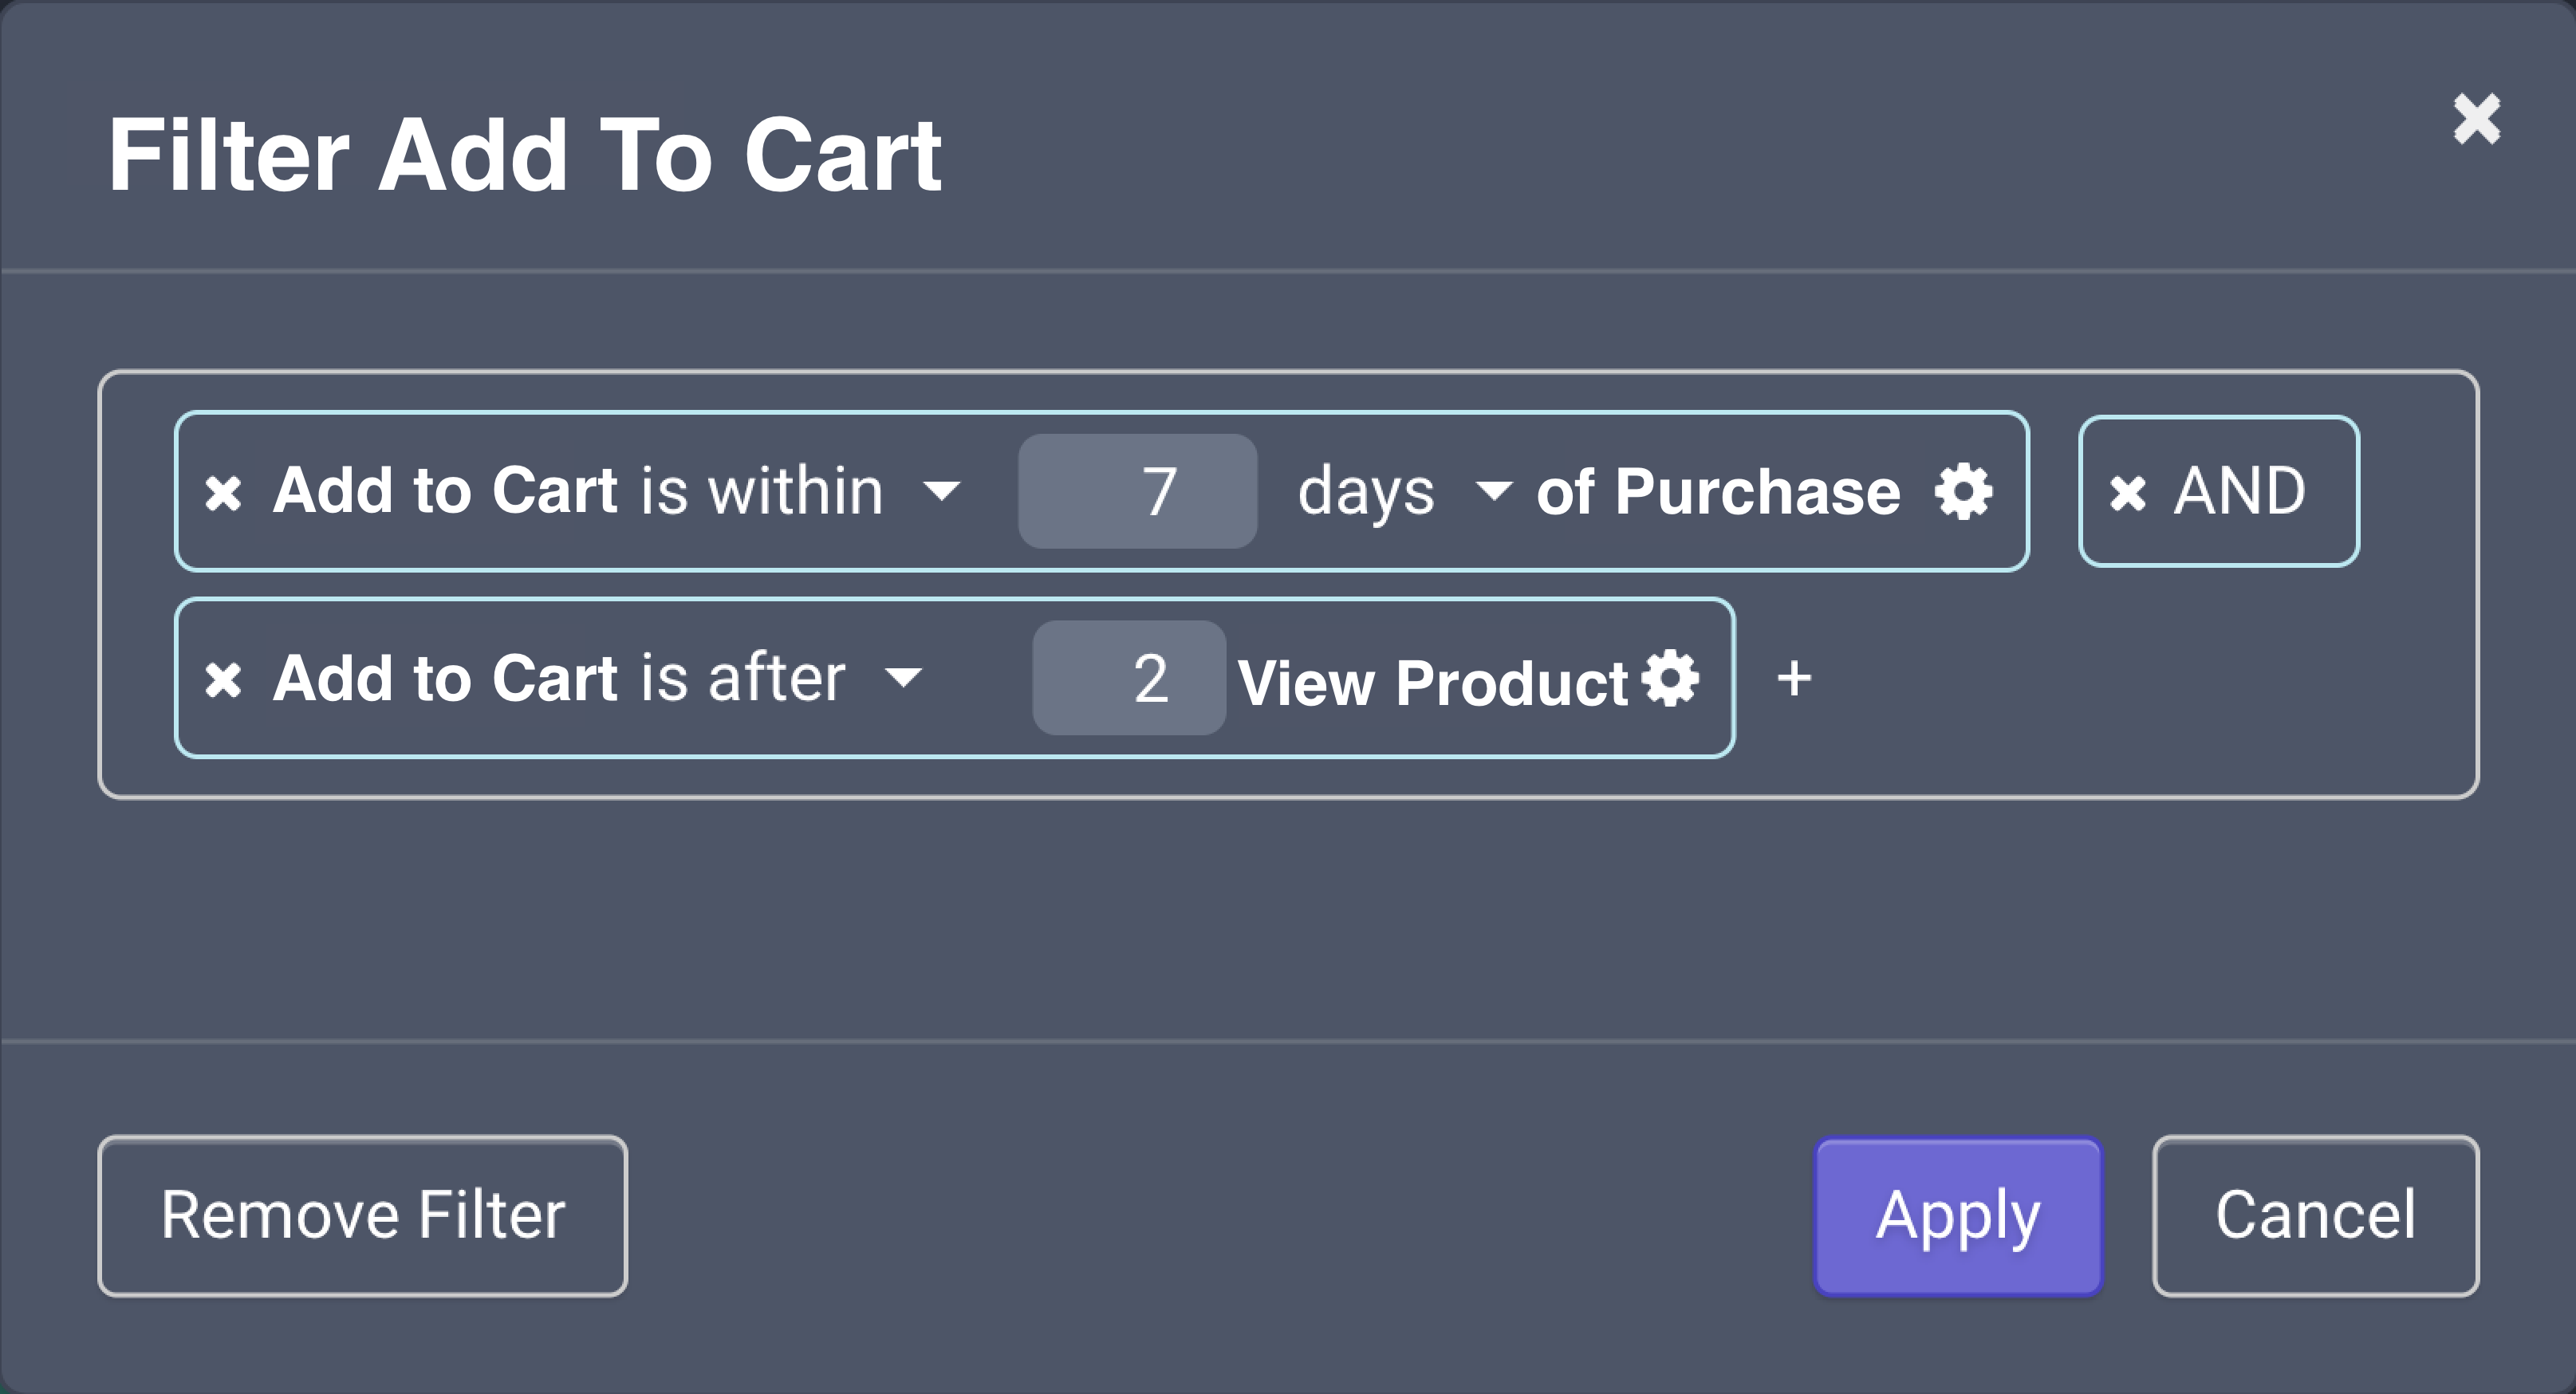
At Stormly, we understand that staying ahead of the curve when it comes to understanding user behavior can be a difficult task.
Only count Add To Cart that happened within 7 days of making a purchase and at least 2 products were viewed? No problem!
E-commerce reports that your team will love ❤️
Ecommerce reports your team will love: clear, SKU aware views for cart abandonment, new arrivals, product and variant performance, and more. Filter by brand, category, channel, or country, pin the best views to a dashboard, and share weekly email digests so everyone knows what to fix and what to scale.
Stormly has a lot to offer and is the best choice for your business. Check out our comparions page so you can see how Stormly stacks up against alternatives such as Amplitude, Mixpanel, Google Analytics, Power BI, Tableau or Looker.
Why Ecommerce Teams Choose Stormly
- Built for product analytics in ecommerce — SKU-aware from day one
- AI that tells you what changed and what to do
- Reports that match real workflows in merchandising, growth, and ops
- Fast time to value with Shopify, Adobe Commerce / Magento, GTM, and CDP integrations
Plug-and-Play Data Integrations
Connect your store and start measuring product performance in hours, not weeks.
- Shopify — ingest standard ecommerce events and product feed
- Adobe Commerce / Magento — install the Stormly plugin and add your API key
- Google Tag Manager — use our tags and data layer guide to stream events
- CDPs — Segment, mParticle, RudderStack destinations supported
- APIs & SDKs — React, Vue, React Native, and server-side endpoints
We automatically join events to your catalog so every insight is SKU, brand, and category aware.
Get Started
Connect your store, choose a report like Cart Abandonment or New Arrivals, and turn on the AI email summary. You will have actionable insights within hours.


